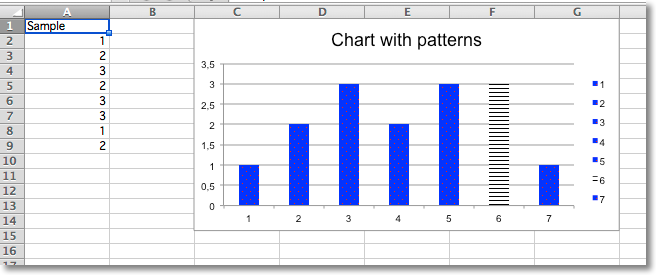
Adding Patterns
Whole data series and individual data points can be extensively styled through the graphicalProperties. Getting things just right may take some time.
from fastpyxl import Workbook
from fastpyxl.chart import BarChart, Reference
from fastpyxl.chart.marker import DataPoint

from fastpyxl.drawing.fill import PatternFillProperties, ColorChoice

wb = Workbook()
ws = wb.active

rows = [
    ("Sample",),
    (1,),
    (2,),
    (3,),
    (2,),
    (3,),
    (3,),
    (1,),
    (2,),
]

for r in rows:
    ws.append(r)


c = BarChart()
data = Reference(ws, min_col=1, min_row=1, max_row=8)
c.add_data(data, titles_from_data=True)
c.title = "Chart with patterns"

# set a pattern for the whole series
series = c.series[0]
fill =  PatternFillProperties(prst="pct5")
fill.foreground = ColorChoice(prstClr="red")
fill.background = ColorChoice(prstClr="blue")
series.graphicalProperties.pattFill = fill

# set a pattern for a 6th data point (0-indexed)
pt = DataPoint(idx=5)
pt.graphicalProperties.pattFill = PatternFillProperties(prst="ltHorz")
series.dPt.append(pt)

ws.add_chart(c, "C1")

wb.save("pattern.xlsx")